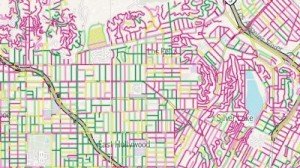
Explore pavement quality ratings for each of the 68,000 street segments in L.A., graded from A to F.
From the L.A. Times, May 4, 2013
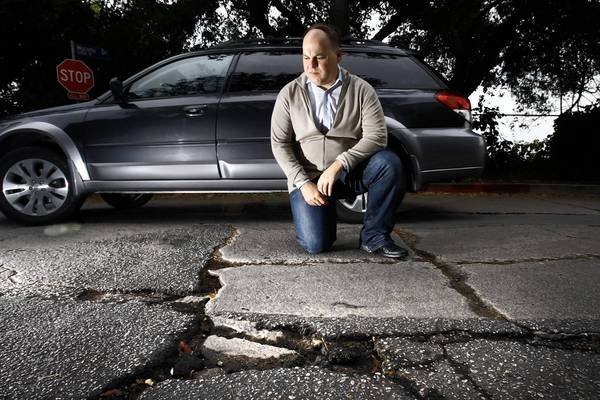
A drive along Angus Street in hilly Silver Lake requires navigating a gantlet of buckled concrete slabs and dirt-filled cracks.
But on South Seabluff Drive in Playa Vista the ride is smooth, the pavement is black and you can smell the fresh asphalt.
Despite the city’s best efforts to keep up with the constant flood of road repairs, Los Angeles is a city divided — by its potholes, cracks and ruts.
Interactive map: See your street’s grade
A Times analysis of street inspection data found wide disparities in road quality among the city’s 114 neighborhoods.
The streets in the newer development of Playa Vista, which the city’s database gives the highest ranking with an average grade of B, scored 80% higher than those in Silver Lake, which ranks among the worst with a D-minus average.
 The differences are not driven by wealth or political power. In fact, some of the poorest parts of the city have some of the best roads.
The heart of the problem is aging streets, heavy traffic, undulating terrain and the sheer size of the network. The streets in the poorest shape tend to be in hillside neighborhoods, such as the Hollywood Hills, Mount Washington, Los Feliz and Bel-Air.
But layered on top of those problems is a street repair strategy that bypasses the worst streets in favor of preserving salvageable ones. Street officials have also made a political decision to bring the overall grade of roads in each City Council district to the same level.
For Angelenos waiting for their street to be rebuilt, abandon all hope: There is a 60-year backlog of failed streets — meaning residents might not see them fixed in their lifetimes.
“If you ask people ‘How many of you have been a victim of crime today?’ nobody will raise their hand,” said Rusty Millar, a Silver Lake Neighborhood Council representative. “If you ask ‘How many of you have been a victim of bad streets and traffic?,’ everybody will raise their hand.”
::
With its stately homes and manicured lawns, Hancock Park is one of the wealthiest areas in L.A. and considered one of the city’s historical gems. But that hasn’t helped get its mostly ancient concrete streets repaired: The neighborhood has an overall D-minus grade.
Hancock Park residents Michael and Ruth Steinberger live on Rimpau Boulevard, which was graded F when last inspected. They have complained to the city that their street has a severe rut at the intersection with 3rd Street that has scraped the undercarriage of their Mercedes countless times.
“It ruins every car,” Ruth Steinberger said. “And God forbid you don’t know about it and you are coming in at normal speeds — you can get hurt.”
After decades of neglect, Los Angeles is trying to play catch-up in places like Hancock Park.
It’s a Herculean task, given the size of L.A.’s street network — the largest municipal system in the country with 6,500 miles of paved roadway. Factor the number of lanes into the equation and there are enough miles of road in the city to build a 10-lane freeway from here to New York City.
The average grade of the city’s roads is a C. The network scores lower than all 10 of the most populous counties in the state, according to city and state data.
But the average grade tells only part of the story. More than one-third of the streets in the city have a score of D or worse, meaning they must be resurfaced or totally reconstructed.
“I not only sympathize with those residents, I also empathize,” said Nazario Sauceda, director of the city Bureau of Street Services. “I can tell you with a straight face that we are doing the best we can with the money we have.”
In some neighborhoods, such as Silver Lake and Hancock Park, more than half the streets are graded F, the Times analysis found. Those streets have foot-deep potholes and giant cracks that can flatten tires and ruin suspensions.
At the other end of the spectrum, nearly half of Winnetka’s streets and more than half of Playa Vista’s are graded A.
The city’s goal is to raise its entire street network to a B average, but that can’t be done without more than $2.6 billion in new money, according to the city.
This year, the aim is to work on roughly 800 miles of road. Most of that — about 70% — involves applying crack and slurry seal to preserve roads. The rest is the much more expensive work of resurfacing streets.
Even 20 years ago, the city employed what was called the “windshield method” to find problems — driving around the city and fixing whatever looked bad. At the time, the city adopted a “worst-first” strategy — fixing the broken streets before all others.
But that doesn’t work in the long run because of limited resources. Rebuilding a street is five to 10 times more expensive than patching one. If work crews just replaced the worst streets, hundreds of miles of passable streets would fall into disrepair sooner, city officials said.
In 1998, the city began using a computerized pavement management system to help plan street maintenance and repaving with a constrained budget. Using a state-of-the-art van equipped with cameras and lasers, workers created a database for the roughly 68,000 street segments. The vehicle is outfitted like an undercover FBI surveillance unit; employees inside gather photos and measurements to document pavement distress.
The first time city officials crunched street inspection data was in 2005, and they found big discrepancies in the average street quality ratings among the 15 council districts, ranging from B to D grades. Since then, the bureau has worked hard to narrow those gaps, Sauceda said.
“We don’t have enough money to improve the condition of the network,” he said. “My job is to distribute misery equally.”
The Times analysis found that disparities between council districts persist. Streets in CouncilmanTom LaBonge‘s Hollywood district have an overall grade of D-plus. By comparison, CouncilwomanJan Perry‘s South L.A. district ranks highest with a C-plus grade and an average street quality score that is 26% higher than LaBonge’s.
LaBonge said he isn’t surprised by the Times’ findings because of the age and geography of roads in his district. It includes some of the lowest-scoring hilly neighborhoods. Many of the those areas have hard concrete streets that were built more than 50 years ago and are well beyond their life expectancy, city officials said.
“If you go through Beverly Hills, there isn’t a pothole there,” LaBonge said. “Why? Because every tax dollar stays in Beverly Hills. But in Los Angeles it’s shared from San Pedro to Chatsworth. People in my district want to see improvement, but it’s also a shared city.”
That’s little consolation to homeowner Gregory Leskin, who lives on that treacherous stretch of Angus Street in Silver Lake.
Nearly three years ago, he got fed up with the severe cracking on his block, went online and submitted a request with the street services bureau to fix it. He’s still waiting.
“It’s dilapidated and in desperate need of repair,” said Leskin, a clinical psychologist at UCLA.
::
Earlier this year, Councilmen Joe Buscaino and Mitchell Englander proposed a $3-billion bond issue to fix streets graded D or F but put it on hold after other council members complained there was not enough public outreach. Since then, Buscaino, chairman of the Public Works Committee, has held meetings across the city to get public input on a similar measure that could go on the November 2014 ballot.
There is growing concern at City Hall that the pool of money available for roadwork will shrink dramatically. President Obama‘s federal stimulus package ran out last summer; and funding from Proposition 1B, a statewide measure that passed in 2006, expires in June after providing $87 million for roadwork in Los Angeles.
That money allowed the city to increase its street repair and maintenance spending to an all-time high of $105 million this fiscal year. At the same time, however, the city’s general fund has been contributing far less, down to $1.1 million this year from $32.2 million in 2007, budget officials said.
Additional funding is the only solution to saving the street system in the long run, said John Harvey, director of the University of California Pavement Research Center.
“If you continually under-fund it, there is no magic in pavement management,” Harvey said. “You can’t do it. You are going to continue to deteriorate.”
Times staff writer Ben Welsh contributed to this report.
Interactive map: See your street’s grade
The city’s database of streets maintained by the Bureau of Street Services includes location, rating, street type and last inspection and repair.
The city scores each street segment on a 100-point scale called the pavement condition index. The Times mapped the data to neighborhood and council district boundaries.
Streets located along the borders of neighborhoods or districts were counted for all adjacent areas. The Times analysis took into account the street surface area, work history and pavement deterioration over time.
The pavement database is a snapshot in time from late April and may not reflect recent roadwork or inspections, according to the Street Services bureau.
How the city of L.A. grades streets
A streets: no cracking, no oxidation and no structural failure. No maintenance required.
B streets: minimal cracking, no oxidation and no structural failure. Slurry seal required.
C streets: minimal cracking, zero to 5% of structural failure. Blanketing (repaving) required.
D streets: some cracking, 6% to 35% of structural failure. Resurfacing required.
F streets: major or unsafe cracking, 36% to more than 50% of structural failure. Resurfacing or reconstruction required.
Source: Los Angeles Bureau of Street Services